Material selection charts, often called Ashby charts, plot one material property against another for all the main classes of engineering material. This guide shows how to use them: how to turn a design requirement into a material index, draw that index as a line on a chart, and go from a long list of candidates to a short list worth testing.
The charts cover metals, polymers, elastomers, ceramics, glasses, composites, foams and natural materials. They are among the most useful tools in early design, but they are often shown without explaining how to use them.
If you want the full set of charts with a short note on each, see our Material Selection Charts reference. To compare properties of specific materials, try the Material Selection Tool.
What a material selection chart shows
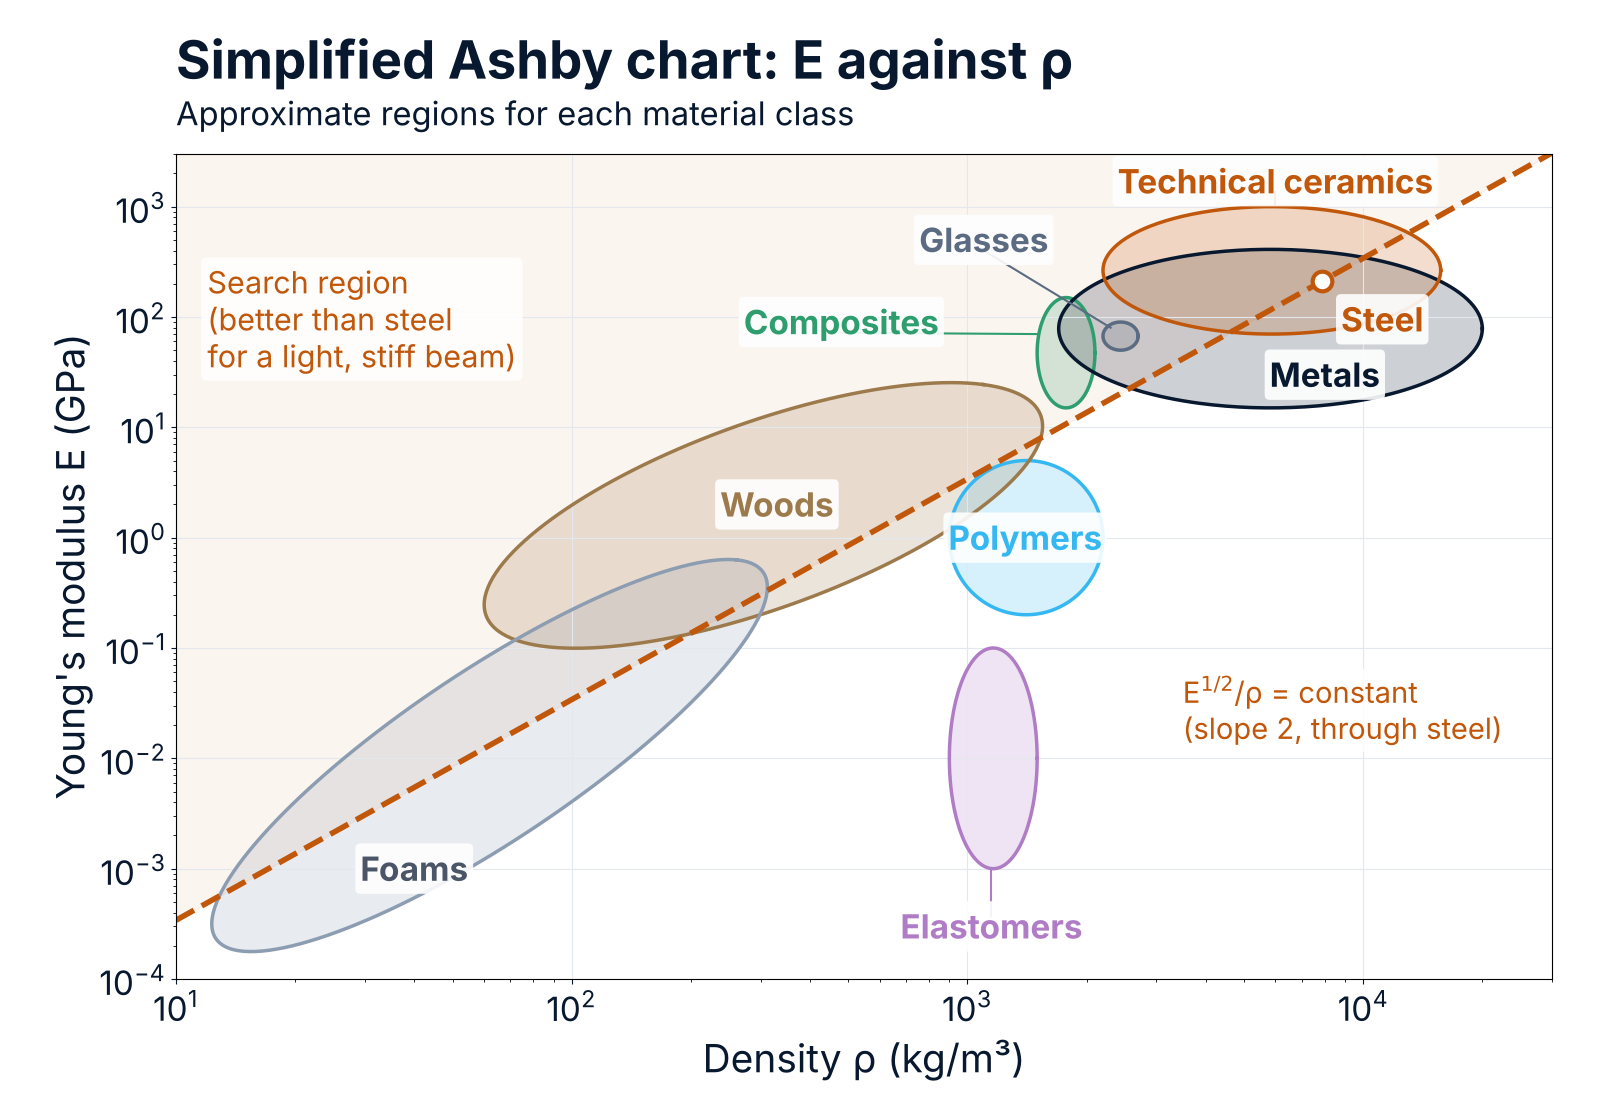
A material selection chart has one property on each axis, for example Young's modulus E on the vertical axis and density ρ on the horizontal axis. Both axes are logarithmic, because engineering materials span a very wide range: the moduli of foams and of ceramics differ by a factor of about a million.
Each material class occupies a region of the chart, and each material inside the class occupies a smaller bubble. The size of the bubble shows how much the property varies between grades and conditions. A chart therefore tells you what is possible with a class of material; it does not give the value for a particular grade.
The logarithmic axes have one big advantage: all materials with the same value of a combination of properties such as E1/2/ρ lie on a straight line. That is what makes the charts a selection tool and not only a data source.
The four steps of material selection
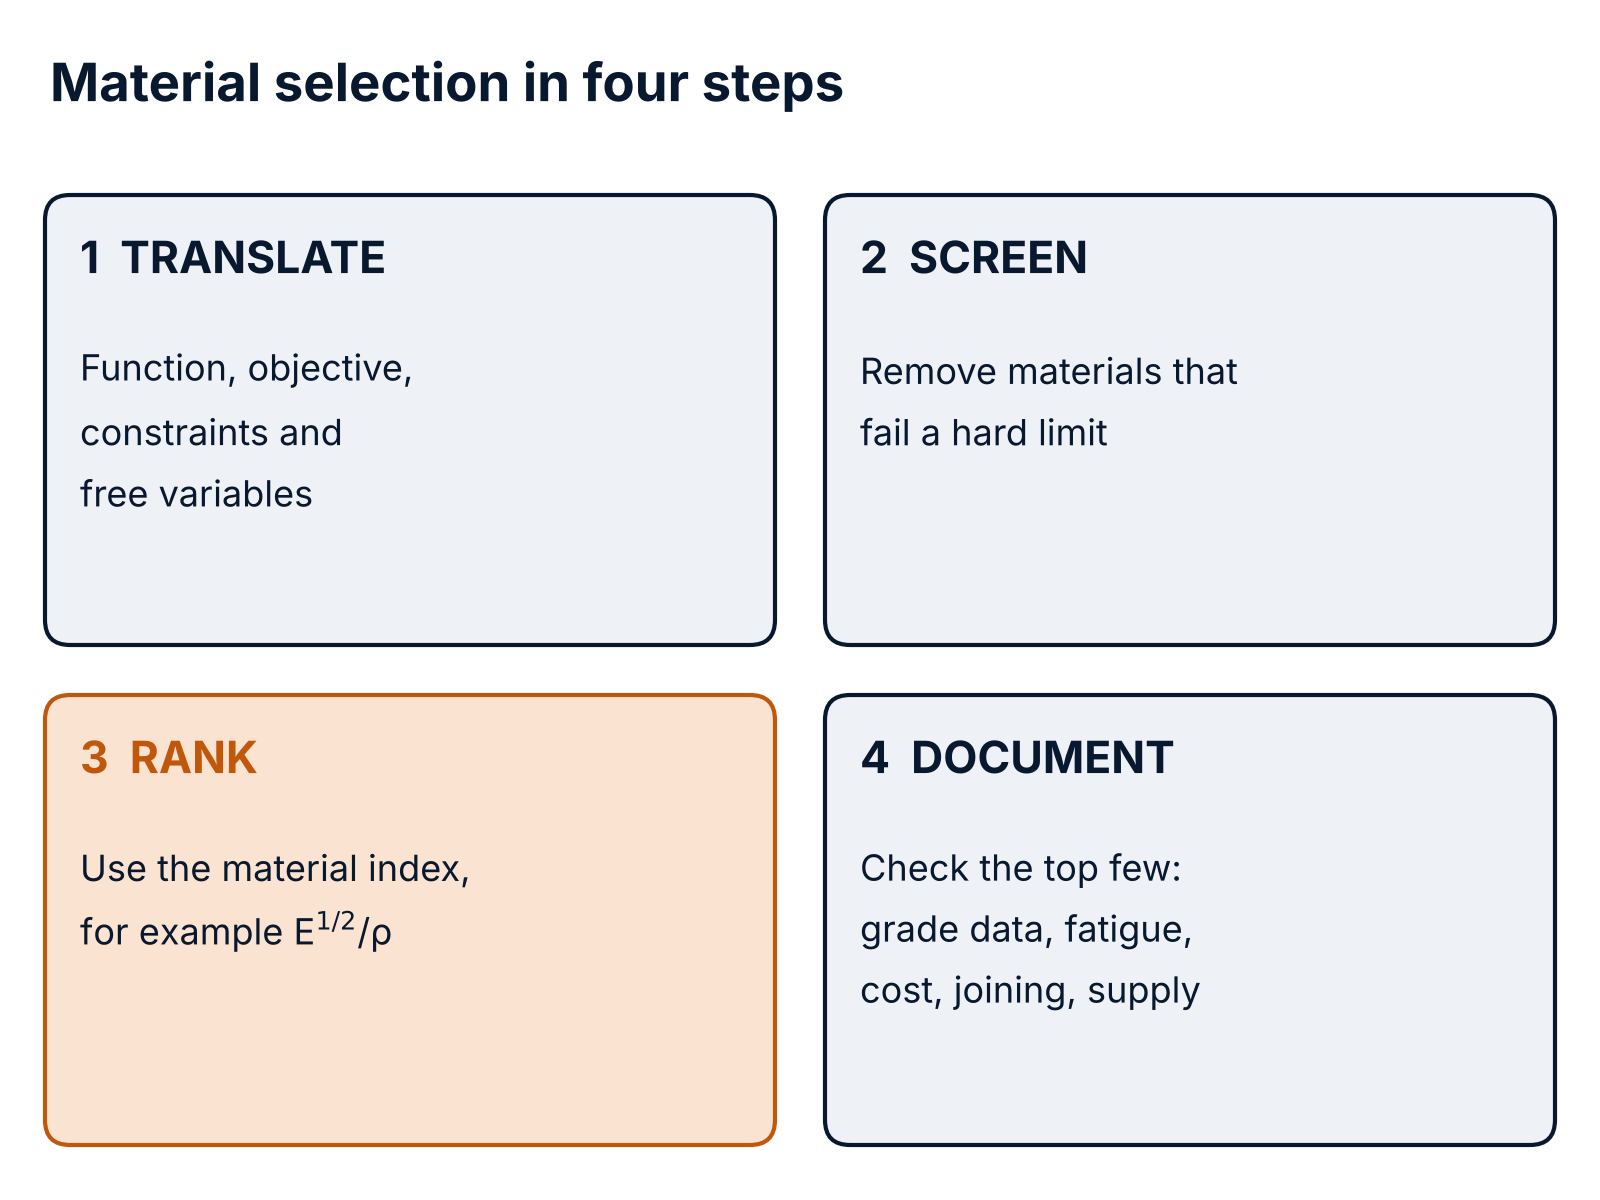
The method developed by Michael Ashby, and widely taught in engineering design courses, has four steps:
- Translate the design requirement into function (what the part does), objective (what to minimise or maximise, such as mass or cost), constraints (what it must meet, such as a stiffness or a maximum temperature) and free variables (what the designer may change, such as the thickness).
- Screen: remove every material that cannot meet a hard limit, for example a maximum service temperature, a minimum fracture toughness, corrosion resistance or electrical insulation.
- Rank the survivors with a material index derived from the objective and the constraints.
- Document: study the top few candidates in detail, using data for the actual grade, and check everything the index does not cover.
What is a material index?
A material index is the combination of material properties that controls the performance of a part when the geometry is free to change. You find it by writing the objective (for example the mass) as an equation, using the constraint to remove the free variable, and seeing which material properties are left.
The three examples below give the most widely used indices. In each case the part must carry a load with a limited deflection (a stiffness constraint), and the objective is the lowest mass. The stiffness formulas used here are explained in our Mechanics of Materials guide.
1. A light, stiff tie (a rod in tension). The length L and the required stiffness S are fixed; the cross-section area A is free.
- Stiffness: S = E·A / L, so A = S·L / E.
- Mass: m = A·L·ρ = S·L² · (ρ / E).
The mass is lowest for the material with the highest E/ρ.
2. A light, stiff beam (square section, size free). The length L and the stiffness S are fixed; the side b of the square section is free.
- Stiffness: S = k·E·I / L³, with I = b⁴/12 and k a constant that depends on the supports and the load.
- Solving for b² and putting it into m = b²·L·ρ gives m = (12·S / k)1/2 · L5/2 · (ρ / E1/2).
The mass is lowest for the material with the highest E1/2/ρ.
3. A light, stiff panel (thickness free). The length L, the width w and the stiffness S are fixed; only the thickness t is free.
- Stiffness: S = k·E·w·t³ / (12·L³).
- Solving for t and putting it into m = w·t·L·ρ gives m ∝ ρ / E1/3.
The mass is lowest for the material with the highest E1/3/ρ.
The same steps with a strength constraint (no yielding) instead of a stiffness constraint give σf/ρ for a tie, σf2/3/ρ for a beam and σf1/2/ρ for a panel, where σf is the yield strength (or the failure strength for brittle materials).
On strength charts, σf is the 0.2 % proof stress for metals, the stress at about 1 % strain for polymers, the tensile strength for composites, and the compressive crushing strength for ceramics and glasses, which is roughly 15 times their tensile strength. For a ceramic or glass loaded in tension or bending, use its tensile (fracture) strength instead.
The difference between the three indices matters. In a tie, the whole cross-section works equally, so mass simply follows ρ/E. In a beam or a panel, bending stiffness grows faster than the material used (with b⁴ or t³), so low-density materials gain an advantage: they can be made thicker for the same mass.
How to draw a material index line on an Ashby chart
Take the beam index M = E1/2/ρ. Taking logarithms gives:
log E = 2·log ρ + 2·log M
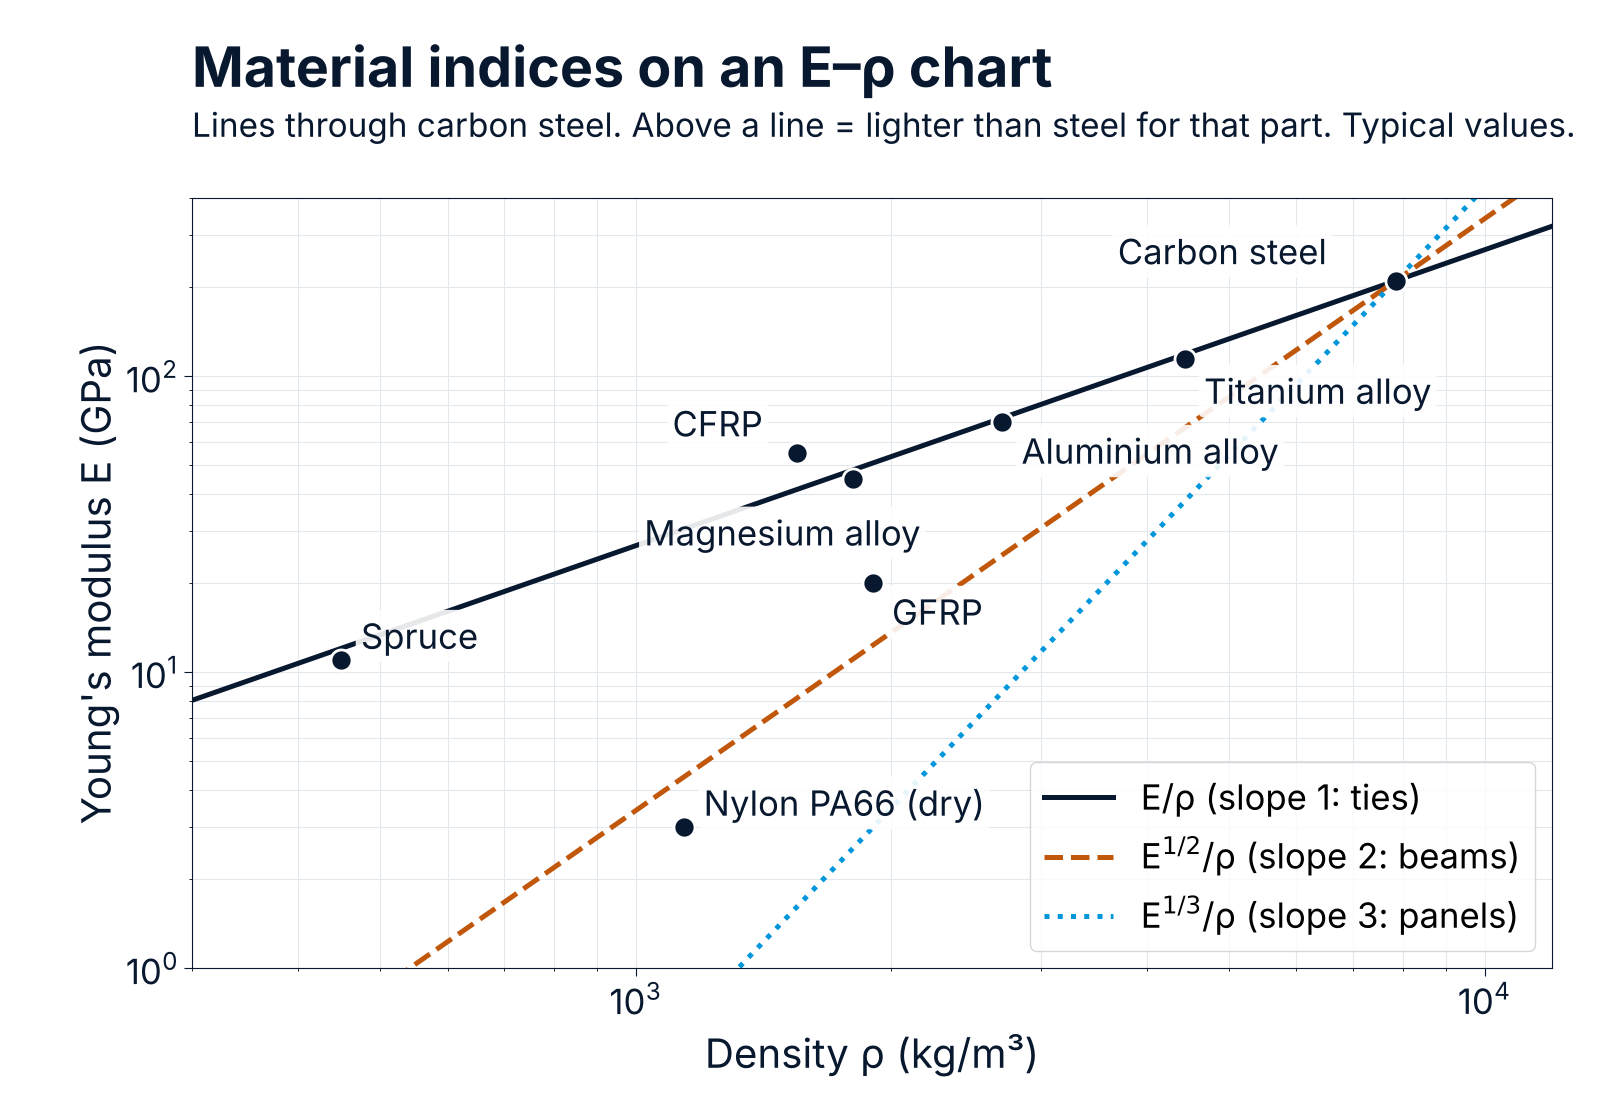
On a chart with log E against log ρ, this is a straight line of slope 2. Every material on the line performs equally well as a light, stiff beam. Materials above the line are better; materials below it are worse. Moving the line upwards and to the left raises M and leaves fewer materials above it. In the same way, E/ρ = constant is a line of slope 1, and E1/3/ρ = constant is a line of slope 3.
To use the line on a chart:
- Pick the chart whose axes contain the properties in your index (E and ρ for a light, stiff beam).
- Draw a line of the right slope (here 2) through a reference material, for example the material you use now.
- Move the line parallel to itself, upwards and to the left, until only a handful of materials or classes remain above it.
- Read off those materials: they are your short list. Check them against the screening limits and then use grade data for the detailed design.
The chart below shows typical values for eight common materials, with the three guide lines drawn through carbon steel.
Worked example: which material makes the lightest part?
Typical, rounded property values. GFRP and CFRP are quasi-isotropic laminates, spruce is measured along the grain and the nylon is dry; real grades vary.
| Material | E (GPa) | ρ (kg/m³) |
|---|---|---|
| Carbon steel | 210 | 7850 |
| Ti-6Al-4V | 114 | 4430 |
| Aluminium alloy | 70 | 2700 |
| Magnesium alloy | 45 | 1800 |
| GFRP | 20 | 1900 |
| CFRP | 55 | 1550 |
| Spruce | 11 | 450 |
| Nylon PA66 | 3 | 1140 |
The table below gives the mass of each part relative to a carbon steel part with the same stiffness and the same length (lower is lighter). The tie column uses the index E/ρ, the beam column E1/2/ρ and the panel column E1/3/ρ. A value below 1 means a lighter part than steel; a value above 1 means a heavier one.
| Material | Tie | Beam | Panel |
|---|---|---|---|
| Carbon steel | 1.00 | 1.00 | 1.00 |
| Ti-6Al-4V | 1.04 | 0.77 | 0.69 |
| Aluminium alloy | 1.03 | 0.60 | 0.50 |
| Magnesium alloy | 1.07 | 0.50 | 0.38 |
| GFRP | 2.54 | 0.78 | 0.53 |
| CFRP | 0.75 | 0.39 | 0.31 |
| Spruce | 1.09 | 0.25 | 0.15 |
| Nylon PA66 | 10.2 | 1.22 | 0.60 |
The relative mass is the steel value of the index divided by the material's value. For example, for the beam: (2101/2/7850) ÷ (701/2/2700) ≈ 0.60 for aluminium.
What the table shows:
- For a tie, the common metals are almost equal. Steel, aluminium, titanium and magnesium all have E/ρ of about 25 MJ/kg. Changing from steel to aluminium does not make a stiff tie lighter; of the materials in the table, only CFRP does (GFRP, also a fibre composite, makes it about 2.5 times heavier).
- For beams and panels, low density wins. Aluminium saves about 40 % of the mass of a steel beam and about 50 % of a steel panel. This is one reason aluminium and composites are used where bending stiffness per kilogram matters, as in aircraft skins, and why aluminium is increasingly used for car bonnets and doors.
- Wood is very efficient in bending along the grain, which explains its long use in beams, floors and masts. It is weak across the grain, sensitive to moisture and creeps under long-term load, so those limits must be screened separately.
- Polymers are poor in tension and in beams but reasonable as panels. Unreinforced nylon needs a part about ten times heavier than steel to be as stiff in tension, and about twenty times heavier once it has absorbed moisture: at 50 % relative humidity PA66 has less than half its dry modulus (about 1.4 GPa instead of 3 GPa).
The same table cannot tell you which material to use. It tells you which few materials deserve a closer look.
Which chart to use for which requirement
A full Ashby chart shows each material class as an envelope of bubbles. The charts below are all in our Material Selection Charts reference.
| Requirement | Chart in the reference |
|---|---|
| Light and stiff | Chart 1: E against ρ |
| Light and strong | Chart 2: σf against ρ |
| Springs, elastic hinges | Chart 3: E against σf |
| Resistance to fracture | Charts 5 and 6: fracture toughness KIc against E and σf |
| Vibration damping | Chart 7: loss coefficient against E |
| Thermal distortion | Chart 10: thermal expansion α against thermal conductivity λ |
| High temperature | Chart 12: σf against maximum service temperature |
| Wear | Chart 14: wear rate constant against hardness |
| Low cost | Charts 16 and 17: E and σf against relative cost |
| Low embodied energy | Charts 19 and 20: E and σf against energy content |
Adding more constraints and cost
Real parts have more than one requirement. Use the charts in sequence:
- Screen with simple limits first. For example: maximum service temperature above 120 °C, or no electrical conduction.
- Rank the survivors with the main index.
- Check a second index on another chart if a second requirement can also drive the size, for example strength as well as stiffness. The material that comes out best on both, or the best compromise, goes on the short list.
To include cost, replace the density ρ in the index by the cost per unit volume, Cm·ρ, where Cm is the price per kilogram. For a beam, the material with the highest E1/2/(Cm·ρ) gives the lowest material cost for the required stiffness. Material prices change, so use current quotes; processing cost often matters more than material cost.
Quick reference: common material indices
Maximise the index for the best performance. In each case the free variable is the size of the section, and the objective is minimum mass (replace ρ by Cm·ρ for minimum cost).
| Part and loading | Stiffness-limited | Strength-limited |
|---|---|---|
| Tie in tension (area free) | E/ρ | σf/ρ |
| Beam in bending, or column in buckling (section size free) | E1/2/ρ | σf2/3/ρ (beam) |
| Panel in bending (thickness free) | E1/3/ρ | σf1/2/ρ |
| Shaft in torsion (diameter free) | G1/2/ρ | τf2/3/ρ |
G is the shear modulus and τf the shear yield strength.
Other useful indices:
- Spring storing the most elastic energy: σf²/E per unit volume, σf²/(E·ρ) per unit mass.
- Elastic hinge (bends a lot without yielding): σf/E.
- Least thermal distortion under a steady heat flow: λ/α, where λ is the thermal conductivity and α the thermal expansion coefficient (for transient heating, use a/α, where a is the thermal diffusivity).
Limitations: what the charts do not tell you
- They give typical values, not design values. Use data for the actual grade, condition and product form (for example the relevant EN or ASTM standard, or the supplier's certified data) for calculations.
- Shape matters. The indices above assume solid sections of a fixed shape that are scaled up or down. Tubes, I-sections and sandwich panels change the result, and some materials can be made into efficient shapes more easily than others.
- Composites and wood are anisotropic. The composite values above are in-plane values for quasi-isotropic laminates (CFRP and GFRP); a unidirectional laminate is much stiffer along the fibres and much less stiff across them. The wood value is along the grain; across the grain the modulus is only about 2 % to 20 % of this, depending on the species and the direction (about 4 % to 8 % for Sitka spruce).
- Many failure modes are not on the charts. Fatigue, corrosion, creep, wear, impact, joining and manufacturability must be checked separately, together with the safety factors your design code requires.
- The best material on paper may not be the best choice. Availability, cost, supplier experience and the way the part will be made often decide the final selection. Once you have a short list, check how each candidate can be made with our Process Attribute Charts.
Further reading: M. F. Ashby, Materials Selection in Mechanical Design, Butterworth-Heinemann (latest edition).
If you need help choosing a material for a new part, ask us for a quote.
Frequently asked questions
What is an Ashby chart?
A material selection chart, named after Professor Michael Ashby of the University of Cambridge, that plots one material property against another on logarithmic scales, so that classes of materials can be compared and material indices drawn as straight lines.
What is a material index?
A combination of material properties, such as E1/2/ρ, that measures how well a material performs in a given part when the part's dimensions are free to change. The higher the index, the better the material for that objective.
What does E^(1/2)/ρ mean?
It is the square root of Young's modulus divided by density, also written √E/ρ or E^0.5/rho. It is the material index for a light, stiff beam: the higher the value, the lighter the beam for a given stiffness. An aluminium alloy scores about 1.7 times higher than carbon steel, so an aluminium beam of equal stiffness has about 60 % of the mass.
Why are the axes logarithmic?
Material properties span many orders of magnitude, and on log axes a power-law index becomes a straight line whose slope shows the loading case.
Can I use the charts for final design?
No. They are for the early stages: narrowing the field to a few candidates. Final sizing and approval need grade-specific data and the checks listed above.