Every part that leaves a machine shop is slightly different from its drawing. On its own, each part can be well inside its tolerance. Put several of them together, though, and the small variations add up. A bearing ends up with no axial float, a cover does not close, or a shaft rubs on a housing that "should" have cleared it. A tolerance stack-up analysis finds these problems on paper, before the parts are made.
This article explains how to build a one-dimensional stack-up step by step, how the worst-case and RSS (root sum square) methods differ, and which mistakes most often make a stack-up wrong.
What is a tolerance stack-up?
A tolerance stack-up is a calculation of how the tolerances of several parts combine at one feature of an assembly. That feature is usually a gap, a clearance, an overlap or an interference, and it has a requirement: for example "the axial float of the bearing must be between 0.30 mm and 0.70 mm".
The parts and dimensions that affect the gap are called contributors. The path that runs from one face of the gap, through the contributors, back to the other face is called the loop (or chain). The stack-up answers two questions: what is the nominal gap, and how far can it move from nominal when every part is somewhere inside its tolerance?
Step-by-step: building a one-dimensional stack-up
- Define the requirement. Write down the gap you are analysing and its limits, for example "G between 0.30 and 0.70 mm". Without a clear requirement there is nothing to check the result against.
- Draw the loop. Sketch the assembly in the direction of the gap. Start at one face of the gap and follow the parts that touch each other until you reach the other face. Only dimensions that lie on this path are contributors.
- Choose a sign convention. Pick a positive direction (for example, to the right) and start the loop at the face of the gap on the negative side (with "to the right" as positive, the left-hand face). A dimension you travel along in the positive direction gets a plus sign; one you travel along in the negative direction gets a minus sign. With this start, the signed sum is the gap itself: a positive result is a clearance and a negative result is an interference. If you start at the other face, every sign flips and the sum is −G.
- List the contributors. For each one, note the nominal value and the tolerance. Convert any unequal tolerance to a mean value with an equal ± tolerance (see below).
- Calculate the nominal gap. Add the signed nominal values.
- Calculate the variation. Use the worst-case method, the RSS method, or both.
- Compare with the requirement and decide: accept the design, tighten a tolerance, change a nominal, or change the design so that fewer parts sit in the loop.
Worked example
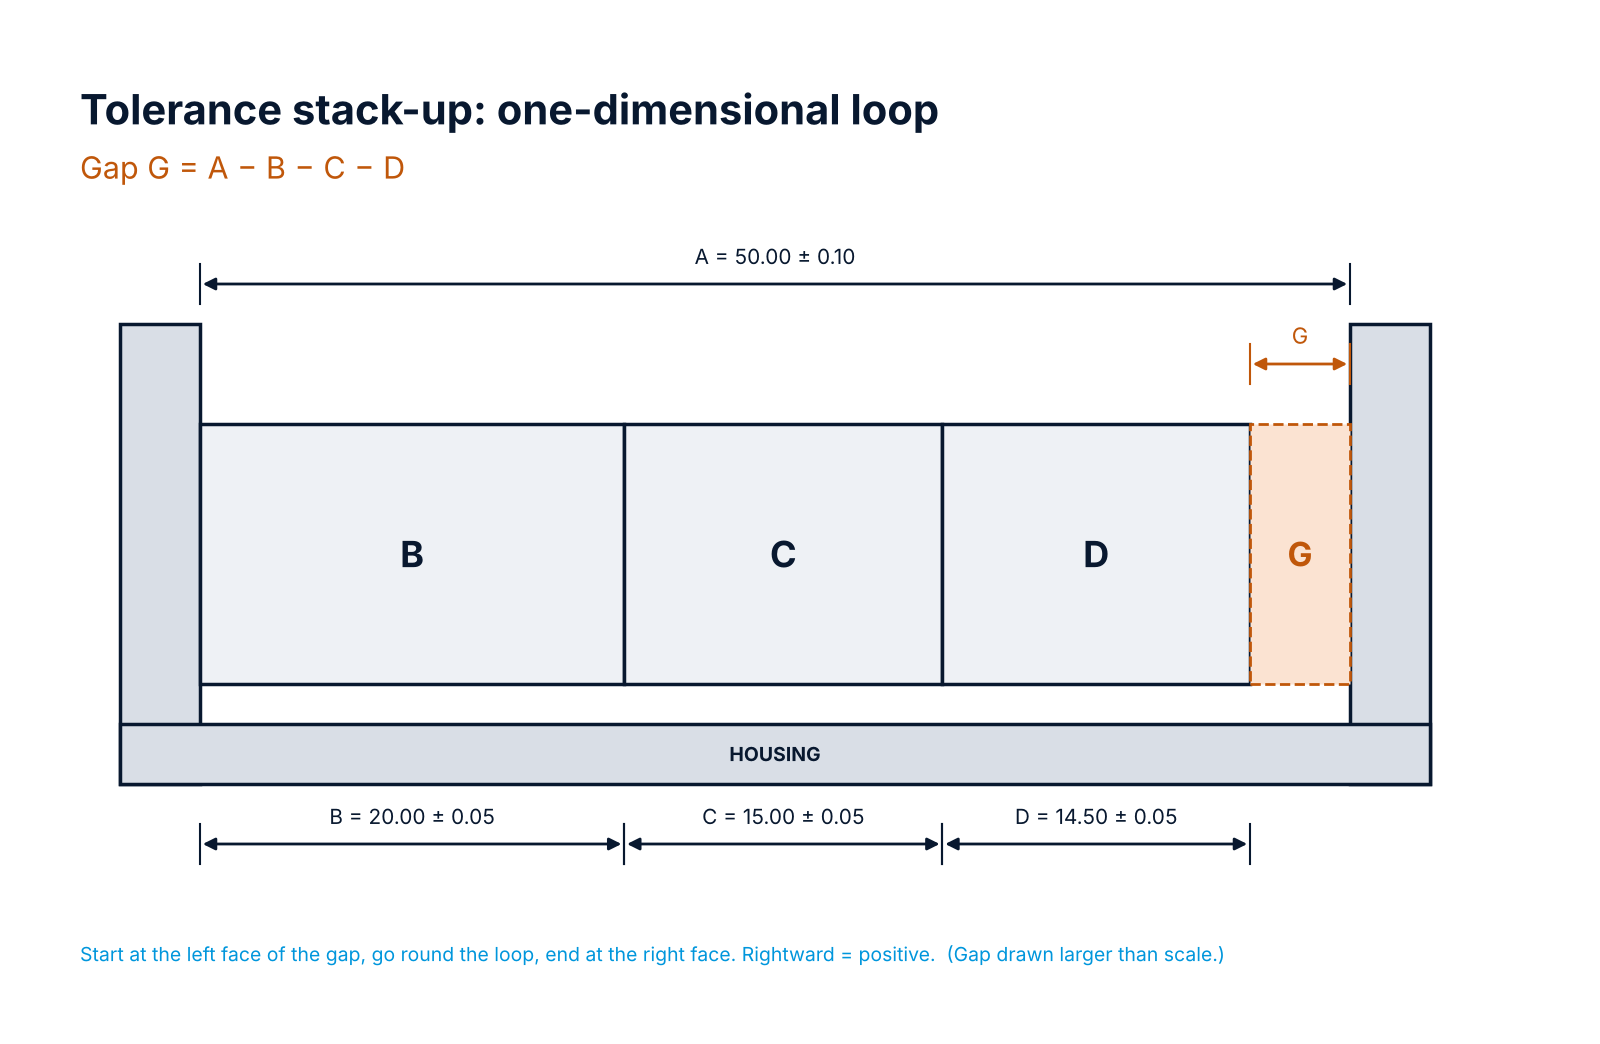
Three parts, B, C and D, sit inside a housing and are pushed against its left shoulder. The internal length of the housing is A. The gap G at the right-hand end is the axial float, and it must be between 0.30 mm and 0.70 mm.
Going round the loop from the left face of the gap (the right-hand end of D): back across D, C and B to the housing shoulder, to the left (−), then along A to the right (+) to the inner face of the housing, which is the other face of the gap. So:
G = A − B − C − D
| Contributor | Nominal (mm) | Tolerance (mm) | Sign |
|---|---|---|---|
| A (housing internal length) | 50.00 | ± 0.10 | + |
| B | 20.00 | ± 0.05 | − |
| C | 15.00 | ± 0.05 | − |
| D | 14.50 | ± 0.05 | − |
Nominal gap: 50.00 − 20.00 − 15.00 − 14.50 = 0.50 mm.
Worst-case method
The worst-case method assumes that every part is at the limit of its tolerance in the unfavourable direction at the same time. The tolerances simply add:
T(worst case) = 0.10 + 0.05 + 0.05 + 0.05 = ± 0.25 mm
So the gap can be anywhere from 0.50 − 0.25 = 0.25 mm to 0.50 + 0.25 = 0.75 mm. That is outside the requirement (0.30 to 0.70 mm) at both ends. So worst case cannot guarantee that every assembly built from in-tolerance parts will meet the requirement.
Worst case is simple and safe: if the worst-case result meets the requirement, every assembly made from in-tolerance parts will meet it too, for the effects you have included in the loop. The price is that it often asks for tighter (more expensive) tolerances than the parts really need, especially when there are many contributors.
RSS (statistical) method
In real production it is very unlikely that all parts are at their worst limit at the same time. The RSS method uses this. It takes the square root of the sum of the squares of the tolerances:
T(RSS) = √(0.10² + 0.05² + 0.05² + 0.05²) = √0.0175 ≈ ± 0.132 mm
So about 99.73 % of assemblies are expected to fall between 0.368 mm and 0.632 mm, which is inside the requirement, provided the assumptions below hold.
Both formulas assume a one-dimensional loop in which each dimension changes the gap one-for-one. If a dimension acts at an angle or through a lever, multiply both its nominal and its tolerance by its sensitivity (for example cos θ) before you add the nominals or combine the tolerances; in worst case add the absolute values of the scaled tolerances, and in RSS square them.
RSS is only valid when its assumptions hold:
- the contributors vary independently of each other;
- each dimension is roughly normally distributed and centred on the middle of its tolerance band (the mean value used in the stack);
- each tolerance covers at least ± 3 standard deviations of the process (Cp of 1 or more); if it covers more, the RSS prediction is conservative.
When these hold, at least about 99.73 % of assemblies fall inside the RSS limits. If the processes are not centred or not capable, RSS will be optimistic. Some companies multiply the RSS result by a factor of about 1.5 to allow for this, sometimes called a modified or inflated RSS. In this example 1.5 × 0.132 ≈ ± 0.198 mm gives 0.302 to 0.698 mm, still just inside the requirement.
What to do when the stack-up fails
In the example, worst case fails and RSS passes. The designer now has a real decision to make:
- Accept the statistical result only if you have process data showing that each part comes from a capable, stable process whose mean sits close to the middle of its tolerance band (for example a Cpk of 1.33 or more with Cp and Cpk close together; Cpk on its own does not show that a process is centred), the parts are not all from one batch or one machine set-up (which makes them vary together), and an occasional out-of-limit assembly can be caught and reworked. With only four contributors, and A alone carrying more than half of the variance, the RSS saving rests heavily on these assumptions; for a low-volume machine, worst case is usually the safer basis.
- Tighten the largest contributor. A has the biggest tolerance. Tightening A from ± 0.10 to ± 0.05 gives a worst case of ± 0.20 mm and a gap of 0.30 to 0.70 mm. That meets the requirement for every assembly at the reference temperature, but with no margin left: any effect not in the table, such as the thermal growth shown under Common mistakes (about +0.02 mm for a 40 K rise), would push the largest gap out of limits. In practice, aim for some margin or include those effects as contributors. The RSS result becomes ± 0.10 mm (0.40 to 0.60 mm).
- Shorten the loop. Fewer parts in the loop means less variation. A design that locates the bearing directly from one datum, or adds a shim or adjustable spacer set at assembly, can remove most of the stack.
Start with the tolerance that contributes most. In RSS, each contributor's share of the total variance is proportional to its tolerance squared: here A alone accounts for 0.0100 of the 0.0175 total, about 57 % (in worst case its share is 0.10 of 0.25, 40 %).
Unequal tolerances
Drawings often give unequal tolerances such as 20.00 +0.10/−0.00. Before you add them, convert each one to a mean value with an equal tolerance:
- 20.00 +0.10/−0.00 is 20.00 to 20.10 mm, so it becomes 20.05 ± 0.05 mm.
Use the mean values to calculate the nominal gap and the equal ± values for the variation. Mixing unequal tolerances directly into the sums is one of the most common sources of error.
Geometric tolerances in a stack-up
GD&T callouts are contributors too. A position tolerance of Ø0.2 mm at RFS lets the axis of a hole move up to 0.1 mm in any direction, so it enters a one-dimensional stack as ± 0.1 mm. A profile tolerance on a mating face, located from the datums in the loop, enters the stack as ± half its zone width about the true profile when the zone is equal-bilateral; for a unilateral or unequally disposed zone (Ⓤ in ASME, UZ in ISO), use the centre of the zone as the mean value and ± half the zone width as the tolerance, as for unequal size tolerances. Form tolerances such as flatness are usually already contained in another tolerance that bounds the surface: the limits of size of a feature of size (the envelope rule, Rule #1 in ASME Y14.5), or a profile tolerance that locates the face. In those cases they are not added again. Count them separately where no such boundary applies: for example where the drawing invokes independency, or where the drawing is to ISO GPS (ISO 8015), under which size does not control form unless the envelope symbol Ⓔ is shown. When a feature has a maximum material condition (MMC) modifier, the allowed tolerance grows as the feature departs from MMC (bonus tolerance). Because the bonus depends on the actual size, size and position are not independent. If the loop passes through the axis of the hole, take the total position tolerance the hole is allowed when it is at its least material size (the position tolerance stated at MMC plus the full size tolerance of the hole) and enter half of it as ± in the stack. If the loop passes through the surface of the hole, work from its virtual and resultant condition boundaries instead of adding size and position separately, or you will count the bonus twice. If a datum feature is referenced at MMB, datum feature shift is a further contributor. Our GD&T article gives an overview of the geometric tolerance symbols; the material condition modifiers, bonus tolerance, virtual and resultant condition and datum feature shift are covered in ASME Y14.5-2018; for ISO drawings, the equivalent rules (the maximum and least material requirements, virtual condition, and their application to datum features) are in ISO 2692.
Common mistakes
- Wrong signs. A contributor added instead of subtracted gives a nominal gap that is simply wrong. Always draw the loop and mark the direction.
- Dimensions that are not on the loop. Only dimensions between the faces that actually touch belong in the stack. A dimension from an unrelated feature can look relevant but is not.
- Dimensioning that does not match the function. If the drawing dimensions a feature from a different datum than the one that locates it in the assembly, extra dimensions enter the loop and the stack grows. Dimension from functional datums where you can.
- Forgetting assembly float. Clearance holes, slots and loose fits let parts move during assembly. That movement is a contributor.
- Forgetting temperature. Parts of different materials grow at different rates. With a 50 mm aluminium housing (about 23 × 10⁻⁶ /K) and 49.5 mm of carbon-steel parts (about 12 × 10⁻⁶ /K), a uniform 40 K rise opens the gap by roughly 0.046 − 0.024 ≈ 0.022 mm. Use the coefficient of the actual grade (austenitic stainless steel is about 17 × 10⁻⁶ /K), and check temperature differences between parts too.
- Coatings and plating. A coating adds thickness to every coated face in the loop, and its thickness tolerance is a contributor too, unless the drawing dimension already applies after coating.
- Using RSS with very few contributors or with processes that are not capable. With two or three parts, the sum does not tend towards a normal distribution, so the 99.73 % prediction depends heavily on each part's real distribution, and one part that is skewed or off-centre can make the RSS range badly optimistic. More contributors do not fully cure this. The central limit theorem makes the shape of the sum more normal, so skew matters less as parts are added, but it does not correct a part whose standard deviation is more than one third of its tolerance or whose mean is not at the middle of its tolerance band; RSS assumes that neither happens. If every part's sizes are spread evenly across its whole tolerance band, about 7 to 8 % of assemblies fall outside the RSS range instead of 0.27 %, however many parts are in the loop. When one contributor is much larger than all the others, the RSS result approaches that contributor's own tolerance, so the saving is small and the result depends almost entirely on that one part's distribution.
When to use which method
Use worst case for safety-related functions, for low volumes where every assembly must work, and when the loop has only a few parts. Use RSS for higher volumes from capable processes, where a very small rate of rework is acceptable and tight worst-case tolerances would add cost. Many engineers run both: worst case shows the extreme, RSS shows what production will usually see.
For non-linear stacks, 2-D or 3-D loops, or processes that are not normal, a Monte Carlo simulation gives the most realistic picture, as long as its input distributions reflect what your suppliers really make. It builds many random assemblies from those distributions and counts how many fall outside the limits. To estimate an out-of-limit rate to within roughly ± 20 % of its value at about 95 % confidence, run about 100 divided by that rate in trials, which gives about 100 out-of-limit assemblies: 100 000 trials for 0.1 %, and 10 million for 10 ppm.
A stack-up is also a design review tool. It shows which dimensions really matter, which helps when you apply DFM and DFA principles and when you choose a manufacturing process that can hold the tolerances that matter (see Process Attribute Charts).
If you want to check a stack quickly, the free tolerance stack-up calculator on proxom.co.uk runs worst case, RSS and Monte Carlo for a linear loop in mm or inch. For an assembly that keeps failing at the same gap, ask us for a quote for a stack-up review of your drawings.